38 viewsEducationPhysics
1

Bhautik Study

Best Solution by NTA Official answer key which improves your neet score and getting success

The graph which shows the variation of the de Broglie wavelength (λ) of a particle and its associated momentum

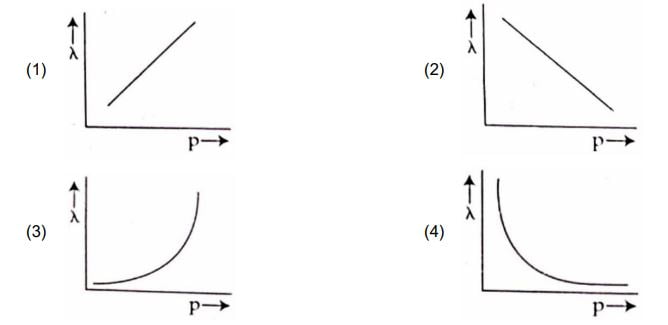
Q. The graph which shows the variation of the de Broglie wavelength (λ) of a particle and its associated momentum (p) is                                                           (NEET-2022)

The graph which shows the variation of the de Broglie wavelength (λ) of a particle and its associated momentum (p) is           

Aditya Bhatt Answered question 11 February 2024
Add a Comment