
Bhautik Study
Physics | CBSE | JEE | NEET
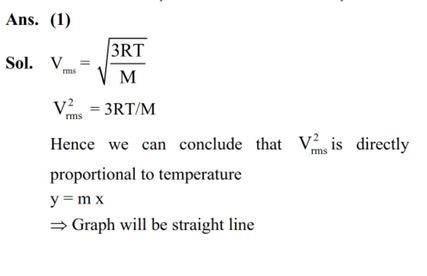
For a particular ideal gas which of the following graphs represents the variation of mean squared velocity of the gas molecules with temperature ?

(JEE-2025)
Physics | CBSE | JEE | NEET
For a particular ideal gas which of the following graphs represents the variation of mean squared velocity of the gas molecules with temperature ?
(JEE-2025)